When can a buy signal be expected?

Generally, there is a 12 bar hold after a signal change. That is the optimized value from past data since 2001. If the market doesn’t fall, then next buy would be Tuesday March 28 after market close.

The Tom DeMark 13 count sequence signal is well regarded. It is rare and indicates a possible market turning point. The last 13 count sell signal was 11/18/2021, 1 day before the market top. Tuesday 3/21 was another 13-count sell. If it plays out like last time over a year ago, the market could start fall in after today. Not a prediction, there is no grantee it will play out the same.

For a good market analysis I recommend the Chris Ciovacco Capital YouTube video published every Friday evening. It is about 35 minutes.

Buy Signal Execution (10/11/2022)

Normally signals are issued after market close to be traded at the open the next day. There is a model component that detects a bottoming pattern. In this case it is usually better to buy at the close the same day.

Of course I don’t know the close ahead of time. I set my trade to execute 5 seconds before the close if it is triggered. A few minutes before that or the open the next day is OK too.

After this, I will publish the trade trigger ahead of time on the signal page when this signal is in play.

Market Update 3/14/2022

Market Update for 3/14/2022

The last Ultimate signal issued was Sell 1/5/2022 after market close. Since then, NDX is down -16.8% and the inverse ETF PSQ is up 17.8%.

Possible change is in the air. There are some strong timing signals March 16,17 which indicate a possible market reversal. There will be a Fed announcement 3/16 also. I am looking for a NDX target of 12,900 to 12,950 to the down side. If this plays out and there is a Buy signal, it may only be for a couple of weeks. This would be a counter trade in an otherwise bear market.

No signal change is issued yet, just a heads up.

The Falling Market

The Falling Market

With IWM down 3.25% today you may be wondering what the model is saying. The model almost issued a sell signal yesterday (5/11/2021). Today that looks like it would have been a good move, but in a few days we may be glad it didn’t. I am working on a new strategy involving buying SPY short term call options when an oversold condition is detected. Today 4 of my 6 indicators are flashing an oversold condition. It has a 78% win rate with an average hold time of 4.5 days, so that is encouraging. I believe the market is over reacting to the CPI numbers and a resulting rise in the 10 year yield today. Once the info is digested the market reverses. I have seen that happen many times. At this point, no upcoming sell signals are anticipated.

Recent Small Cap Underperformance

Recent Small Cap Underperformance

Nov 16, 2021, I advised I was rotating out of QQQ/TQQQ into IWM/URTY. That move paid off handsomely up to 3/12/2021. Since then, QQQ has powered ahead. I believe this is due to small caps being overbought and news of new Covid-19 variants spreading which may delay the reopening.

Is it time to switch back? I plan to stay in small caps at least through the end of 2021. My analysis is based on reversion to the mean as well as some overshoot. Small Caps favor the reopening trade and a fast-expanding economy. Here is a link to one of many articles on the topic.

It is expected there will be some reversals in the rotation along the way. The last time small caps outperformed for a sustained amount of time was 2000 – 2007. This table shows the overall rotation with the hiccups along the way and the current rotation:

There have been larger reversals in the past, I am not too concerned about it. This is a long-term view. The Timing Pundit Ultimate signal is an overall US stock market timing signal based mostly on NASDAQ data. It does not specify what sector to be in. Normally QQQ/TQQQ is best. My rotation to small caps was a separate analysis. If you are concerned about small caps, perhaps a 50/50 allocation would have less volatility.

YTD Summary and Forecast

YTD Summary and Forecast

Even though it has been a brutal week, the small caps IWM and URTY are still above where they were the start of February.  

When I made the call in mid November to switch to small caps, I didn’t expect Big Tech to perform as bad as it has.

Jerome Powell mentioned this week there may be some temporary inflation but nothing to worry about. The bond and stock market overreacted as usual. But once that was absorbed there was a nice turnaround Friday. The concern lately has been the rise in long term interest rates. The FED normally adjusts short term rates and has announce no plans to address long term rates. If it becomes a problem I believe they will act. They always have since the mistake they made raising rates 12/19/2018 during a market free fall, which only accelerated. They started lowering rates the following year.

The market is consolidating and coiling now and I don’t see much downside pressure. I don’t know when, but I look for the next move to be a spike up.

Market Rotation to Small Caps Update

Market Rotation to Small Caps Update

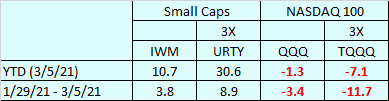
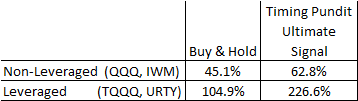
The strong performance of small caps that started last year continues. YTD IWM is up 15.26%, QQQ only 6.94%. Leveraged URTY is up 50.29%, and TQQQ is up 20.12%. In the Russell 2000, 32% of the components are up over 20%, more than all of 2020.

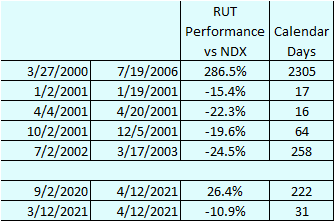
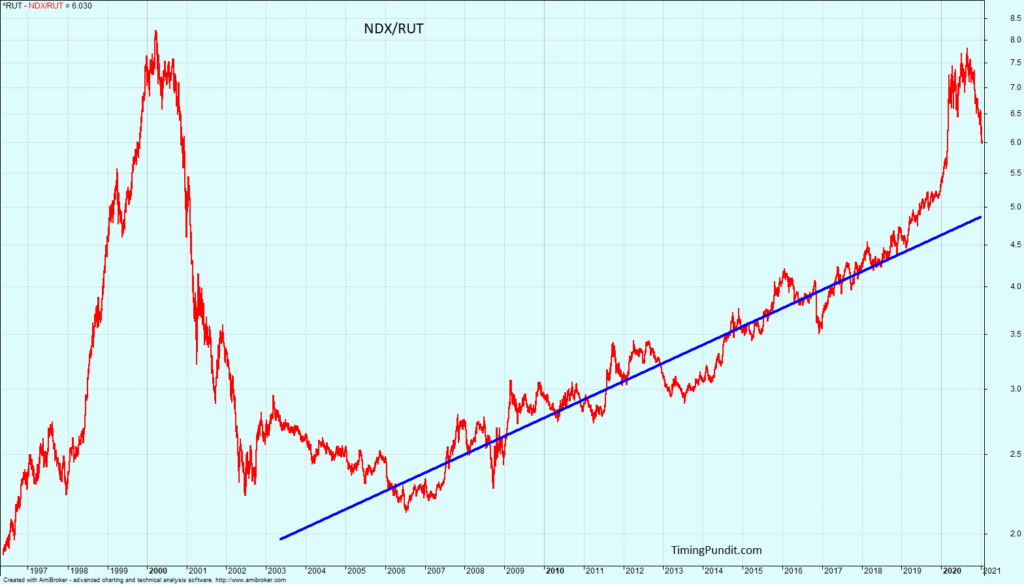
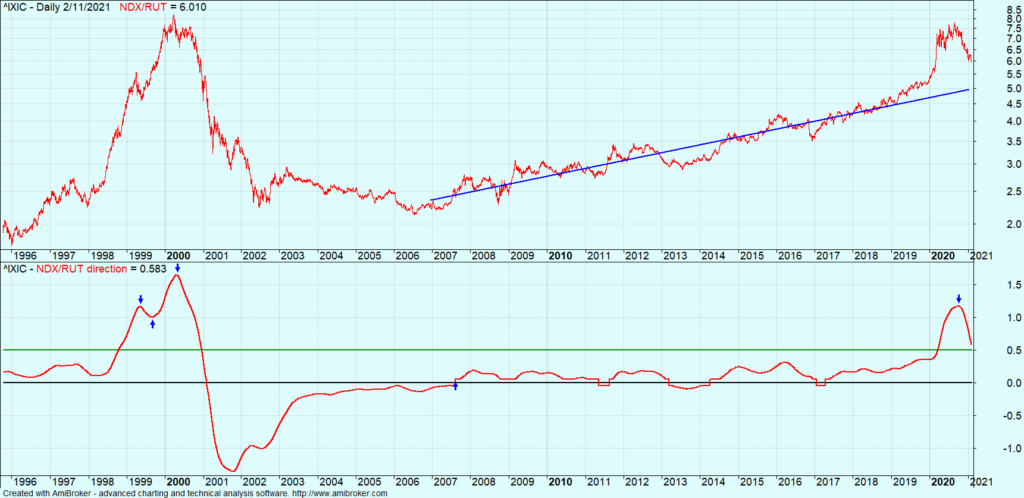
The following graph is an update of the NDX/RUT ratio and the indicator I created to detect a change in leadership.

I’m not the only one that thinks the small cap rally will continue. Here is a nice article from Dow Jones:

The small-cap stock rally is here to stay. Why these analysts say it's bad news for the S&P 500

Provided by Dow Jones

Feb 11, 2021 10:24 AM PST

By Jack Denton

Critical information for the U.S. trading day

The Dow just scraped a record high on Wednesday while other indexes fell, led down by the Russell 2000 — the key index of stocks with a small market capitalization.

But don’t think the little guys are giving up just yet.

Our call of the day is from the financial research specialists at Leuthold Group, led by Doug Ramsey, James Paulsen, and Scott Opsal. They say that “a long-term leadership cycle” in small-cap stocks is under way — and it may be bad news for big indexes.

The Russell 2000 continues to register “ridiculously overbought” readings based on many technical factors, the researchers say, and that could be cause for market caution in the short-term. But the “extreme strength” of the index supports the Leuthold Group’s view that dominance in these stocks is here to stay.

Small-cap performance in January pushed the six-month total-return spread between the Russell 2000 and the S&P 500 above 25% for just the eighth time since 1960.

Now, here’s the kicker: In all of the seven past cases, it was only early or midway through a cycle where small-caps led stocks that the relative strength of the Russell 2000 breached the 25% mark.

That means more is likely to come, but it may not be a healthy sign for the stock market overall.

Since 1960, annualized returns for the S&P 500 were almost 6% lower when small-cap stocks have led. In fact, the researchers at Leuthold say that a portfolio of 50% cash and 50% small-caps could match the S&P 500’s volatility in the next few years while actually exceeding its return.

The backdrop of rising yields is also unlikely to derail this trajectory, the researchers say. Small-cap stocks have actually shown “a decisive performance edge” during recent periods when stock prices and bond yields moved in sync.

Draw Downs, Stop Losses, and the Real Risk

Draw Downs, Stop Losses, and the Real Risk

The TQQQ/URTY strategy can have peak to trough draw downs of 43.1% and trade entry to trough of 28.29% (MAE, Most Adverse Effect.) The risk is too high for some even though the rewards can be great. Let’s take a look at the worst cases. This graph shows the largest MAE.

It only took 6 weeks from the trade entry date to fully recover and go on to make tremendous gains. The next graph shows the shows the worst case MaxDD% peak to trough.

There may have may have been a -43.1% DD but that is small compared to the ultimate 302% gain. You would break even with the perfect stop loss level and would loose with anything else.

But what about a major bear market such as 2000 – 2003 or the great financial crisis?

The graphs put draw downs and volatility in context with the broader market.

When the market goes down, it always comes back up. But when the market goes up, it may never come back down to that level again. It is better to focus on being long in an up market than short in a down market. The market goes up 70 – 75% of the time. “The Real Risk”, being out at the wrong time.

Peter Lynch once said, “Far more money has been lost by investors preparing for corrections, or trying to anticipate corrections, than has been lost in corrections themselves.”

Sector Rotation from Large Cap Techs to Small Caps

Sector Rotation from Large Cap Techs to Small Caps

The small cap Russell 2000 has been on a tear since November. It may continue to outperform the NASDAQ 100 for at least the next few months. The NDX sharply outperformed RUT in the 1st half of 2020. Now the ratio is reverting to the mean. As the graph shows, the ratio has a ways to go before it hits the blue trend-line. RUT outperformed NDX for 6 years after the 2000 crash.

Performance summary for 2020:

Performance summary for 2020:

I’m sure you have heard 2020 was unprecedented, and it was. The model data-set didn’t have a market with such a fast fall, recovery, and new records. But now it does. This year will only make the model better.

The Small Caps have made big gains since I made the call in mid November. You may be wondering if it is time to switch back to the big techs. My analysis indicates Small Caps could continue to out perform for 6-12 months. The only time Small Caps have outperformed for a sustained period since 1990 is when they fallen way behind the Techs and then make a rebound (2000 – 2006). 2020 is only the second time Small Caps have fallen so far behind since 1990, although not as bad as the Dotcom bubble. They outperformed 6 years last time, so it is not inconceivable they could out perform a year or two now. It will be choppy. There could be rotation back to Techs if this new Covid strain really takes off and if vaccines have distribution problems, but it should be temporary.

I have developed an indicator to tell me when to rotate back and I will publish it.

The Ultimate model went live 1/15/2020. Trades are verified by an independent 3rd party, TimerTrac.

Happy New Year and may the odds be with you.