Draw Downs, Stop Losses, and the Real Risk
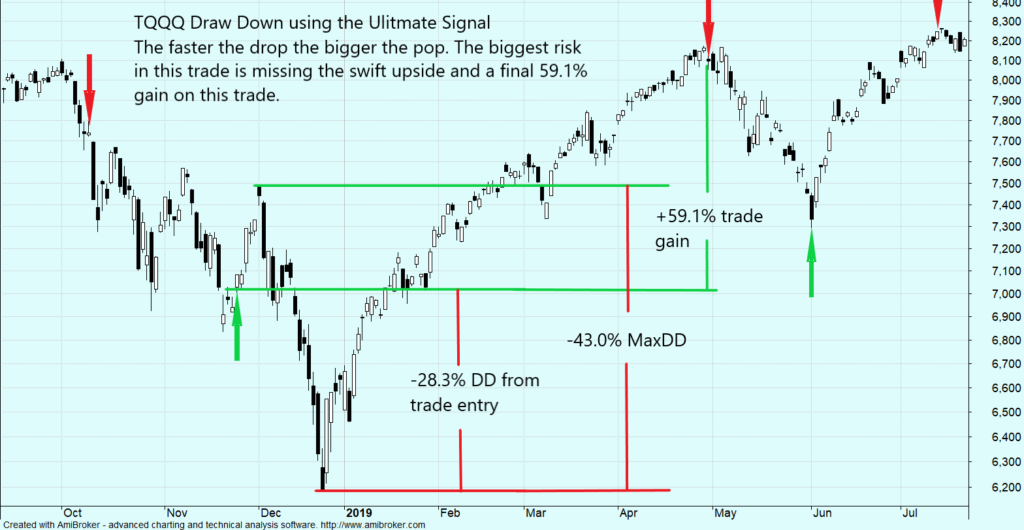
The TQQQ/URTY strategy can have peak to trough draw downs of 43.1% and trade entry to trough of 28.29% (MAE, Most Adverse Effect.) The risk is too high for some even though the rewards can be great. Let’s take a look at the worst cases. This graph shows the largest MAE.

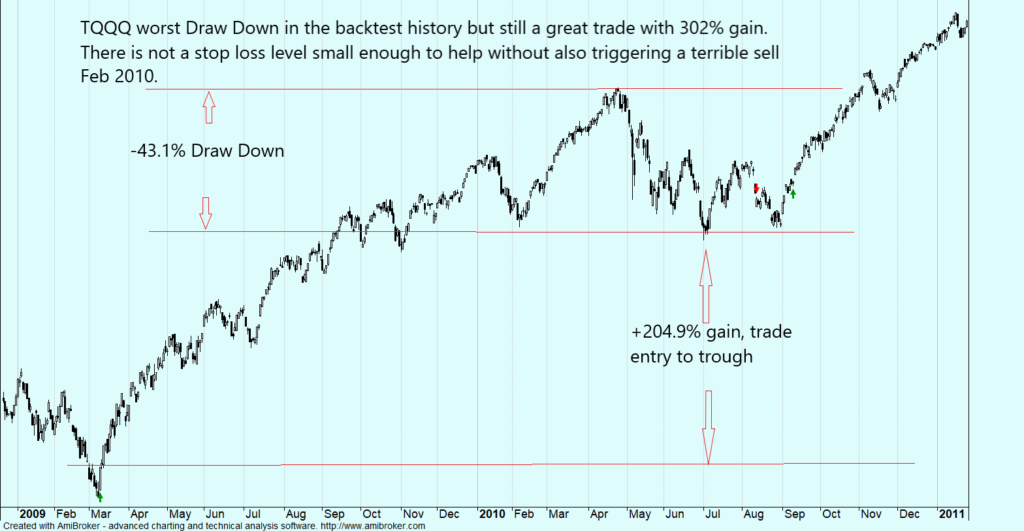
It only took 6 weeks from the trade entry date to fully recover and go on to make tremendous gains. The next graph shows the shows the worst case MaxDD% peak to trough.

There may have may have been a -43.1% DD but that is small compared to the ultimate 302% gain. You would break even with the perfect stop loss level and would loose with anything else.
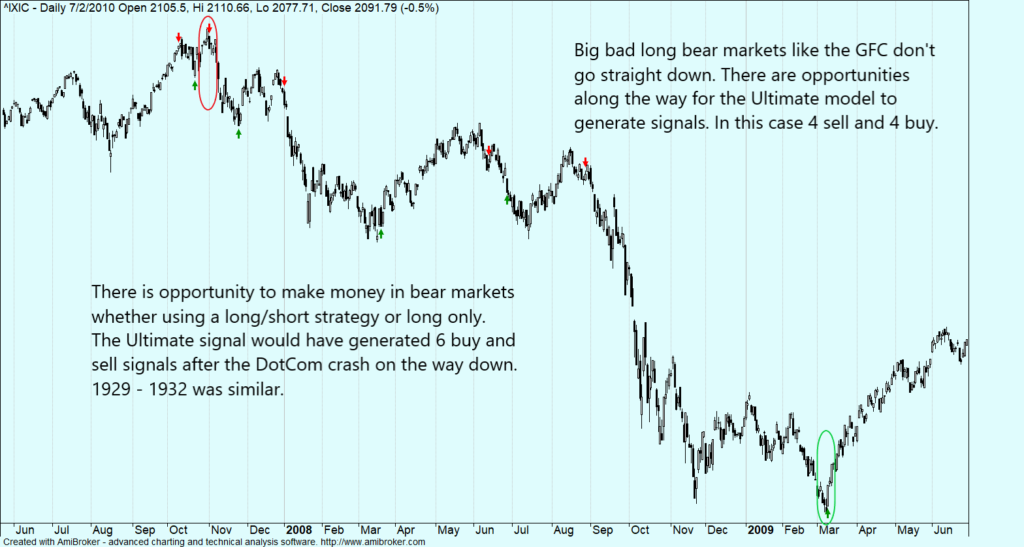
But what about a major bear market such as 2000 – 2003 or the great financial crisis?

The graphs put draw downs and volatility in context with the broader market.
When the market goes down, it always comes back up. But when the market goes up, it may never come back down to that level again. It is better to focus on being long in an up market than short in a down market. The market goes up 70 – 75% of the time. “The Real Risk”, being out at the wrong time.
Peter Lynch once said, “Far more money has been lost by investors preparing for corrections, or trying to anticipate corrections, than has been lost in corrections themselves.”